Short answer
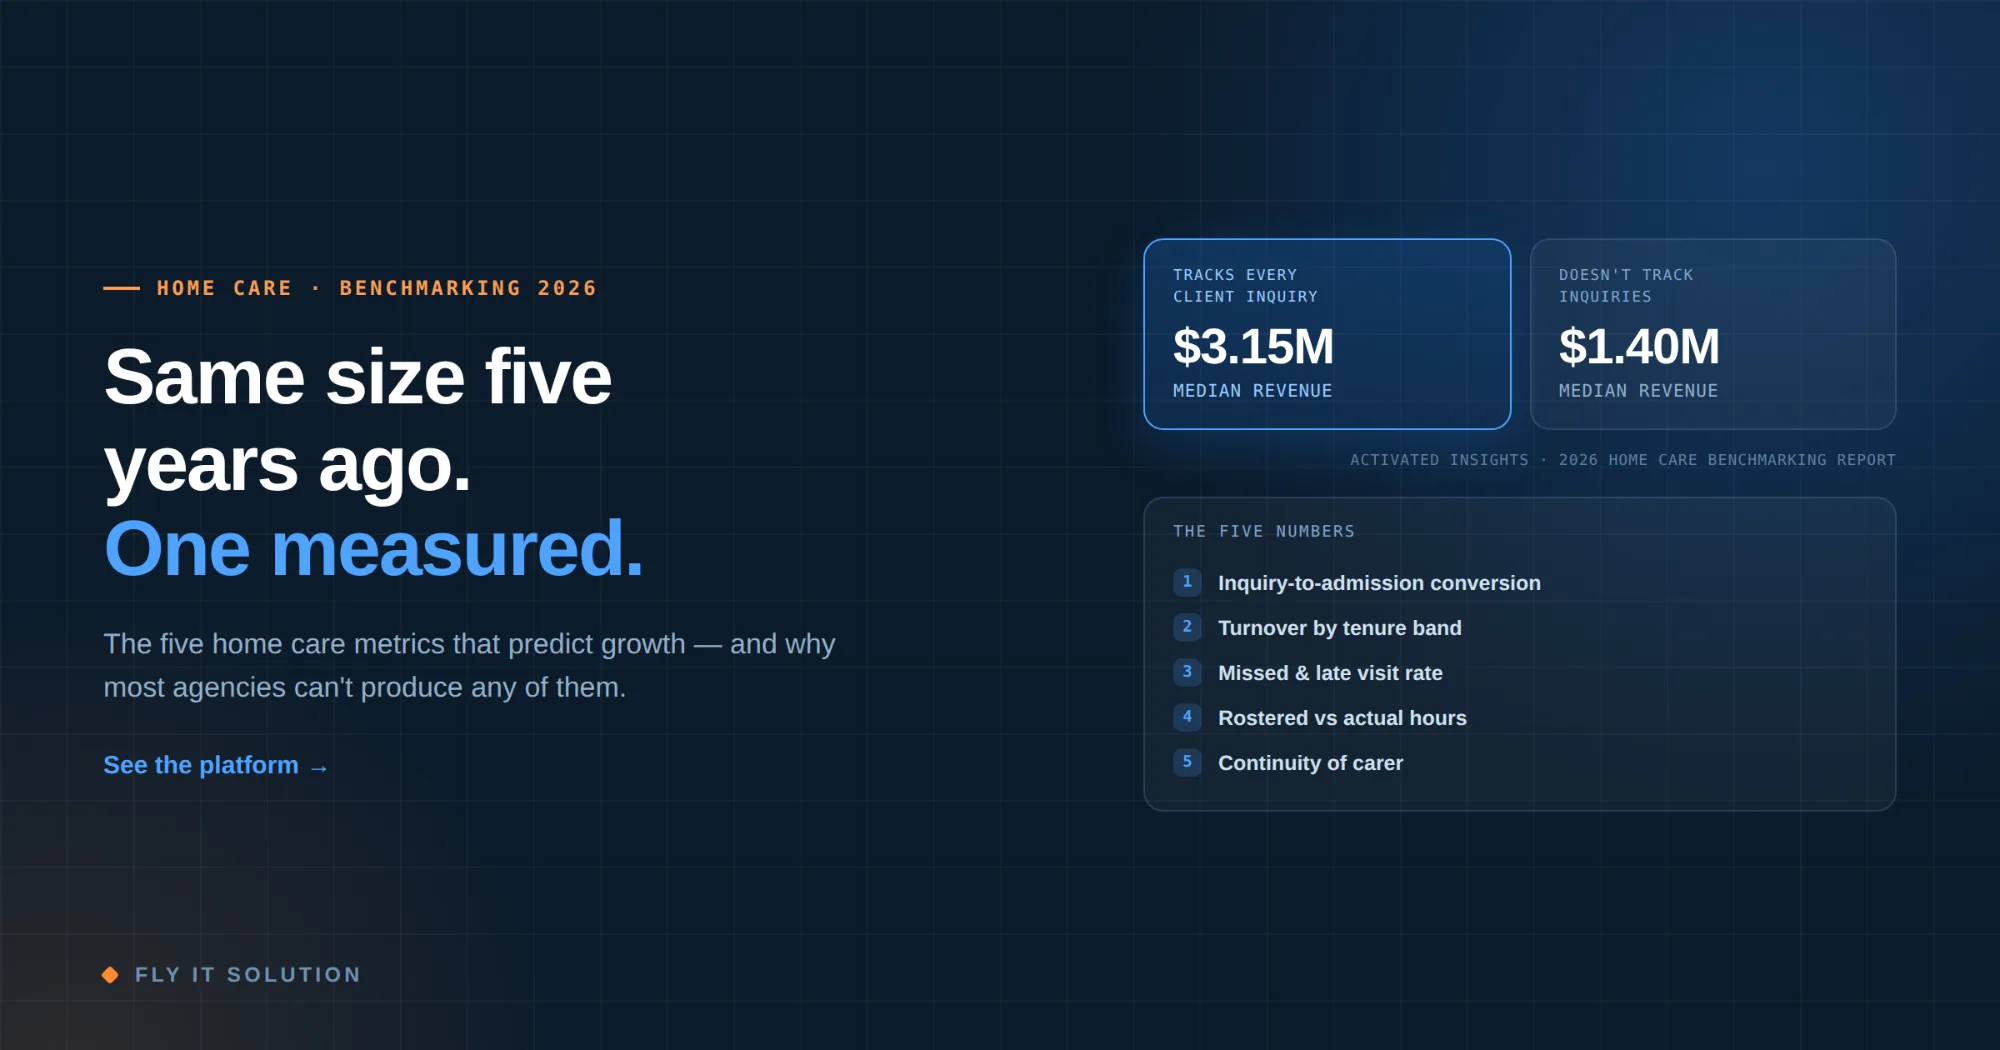
The gap between fast-growing home care agencies and stalled ones isn't carer quality it's measurement. Agencies that track every client inquiry report median revenue of $3.15 million against $1.40 million for those that don't, and that gap has widened for five consecutive years. Five numbers separate the two groups: inquiry-to-admission conversion, carer turnover by tenure band, missed and late visit rate, rostered-versus-actual hours, and continuity of carer. Most agencies track none of them, because their systems can't.
Two agencies, same city, roughly the same size five years ago.
One is now going north of three million. The other is doing under one and a half, with a similar headcount and, as far as anyone can tell, similar carers.
Ask each owner what's different and you'll get answers about culture, or luck, or a difficult local commissioner. Ask what happened to the forty-one enquiries they received last month and only one of them can tell you.
That's not a coincidence. It's the finding.
The measurement gap, and it's widening
The 2026 Activated Insights Home Care Benchmarking Report found that agencies which track every client inquiry report median revenue of $3.15 million, against $1.40 million among agencies that don't and notes that this gap has now grown for five consecutive years (Activated Insights).
Read that carefully, because it's easy to misread as “bigger agencies can afford better systems.”
The causation runs the other way, and it's mechanical. If you don't know how many enquiries you received, you can't know your conversion rate. If you don't know your conversion rate, you can't tell whether a slow month was a demand problem or a response-time problem. So, you can't fix it you can only guess, and guessing gets more expensive as you scale.
The widening is the part I'd pay attention to. A gap that grows for five straight years isn't noise. It's compounding: the measuring agency improves conversion slightly each year, the non-measuring one doesn't, and the difference accumulates.
The five numbers most agencies don't track
None of these require a data analyst. All of them require a system that records the right things at the right moment.
1. Inquiry-to-admission conversion
Every enquiry phone, web form, referral, walk-in logged with a source, a date, an owner, and an outcome.
The two things this tells you that nothing else will: which referral sources convert (not which produce the most enquiries which produce clients), and how long you take to respond. In home care, response time is often the whole ballgame. A family calling around on a Tuesday afternoon usually goes with whoever answers first and can start soonest.
If your answer to “what was our conversion rate last month?” is a shrug or a guess, this is the highest-value number on this list and the cheapest to start collecting.
2. Carer turnover, split by tenure band
Not one turnover number. Three: leavers within 30 days, within 90 days, and after a year.
They have completely different causes. Thirty-day leavers usually mean a recruitment or onboarding mismatch the job wasn't what they expected. Ninety-day leavers usually mean scheduling: not enough hours, or unpredictable hours, or too much unpaid travel. Year-plus leavers are typically pay, progression or burnout.
Agencies that track one blended number can't tell which problem they have, so they treat all three with pay rises — which is the most expensive available answer and often the wrong one.
For context on the size of this: Activated Insights' 2024 Benchmarking Report put home-based care turnover at 79.2% close to four in five people leaving within the year. At that rate, small improvements in the 30- and 90-day bands are worth more than almost anything else you could do.
3. Missed and late visit rate
Missed visits are the ones nobody logs on, because logging them feels like admitting a failure. That's exactly why they're valuable.
A missed visit is a safeguarding issue, a billing issue and a retention issue simultaneously clients leave over them, and so do carers, because carers are usually the ones absorbing the chaos when a run collapses.
Track missed visits, late visits over a threshold you define, and short visits. Then look at whether they cluster: by day, by run, by carer, by client. They almost always cluster, and the cluster tells you where the roster is over-optimistic.
4. Rostered versus actual hours
The variance between what you scheduled and what happened.
This is where money leaks in both directions. Visits that ran long and were never billed. Visits were short but invoiced in full, which is a compliance problem, not just a commercial one. Travel time paid but not funded.
Most agencies discover this variance annually, at audit or year-end. It should be a weekly report, and it takes about ninety seconds to read once it exists.
5. Continuity of carer
What percentage of a client's visits are delivered by their top two carers?
This is the number that predicts client retention better than satisfaction surveys do, and almost nobody measures it. Families rarely complain formally about seeing a different face each week they just leave, eventually, and give a vague reason.
It's also a quality-of-care measure. A carer who knows someone notices the change in them that a stranger doesn't.
Turnover is the tax on every other number
It's worth being honest about what software does and doesn't touch here.
Software doesn't fix pay. If your rates are below the market, no scheduling feature will retain people. That's a business model conversation, not a technology one.
Software does fix a surprising amount of the rest, because a meaningful share of home care turnover isn't about money it's about friction:
•Hour’s instability. Carers need predictable income. A system that shows planned hours ahead and fills gaps quickly protects that; one that runs week-to-week doesn't.
•Unpaid or under-planned travel. If your rostering doesn't model travel time realistically, carers absorb the difference. They notice, and eventually they leave.
•Being unable to raise a concern. A carer who flags something and hears nothing back concludes nobody's listening. An escalation path with a visible response closes that loop.
•Admin friction. Paper timesheets, chasing the office to confirm a shift, re-entering the same information. Small individually. Cumulative across a year.
The 30- and 90-day tenure bands are where this show up, which is why splitting turnover matters. If your 90-day band is worse than your 30-day band, you have a scheduling problem, not a recruitment problem and that one is genuinely fixable with better systems.
What “track every inquiry” means in practice
The benchmarking finding is specific about inquiries, so here's what it means operationally. Every enquiry, however, it arrives, needs six fields:
1. Date and time received for response-time measurement
2. Source website, phone, referral (and which referrer), agency directory, word of mouth
3. What they need is service type, hours, funding route
4. Owner who is responsible for responding
5. Outcome admitted, lost, declined by us, still open
6. If lost, why price, availability, timing, went elsewhere
That's it. Six fields, and it can live in a spreadsheet on day one, this is not an argument that you need to buy something before you can start.
But it does need to be made, including the ones that arrive at a call to a coordinator's mobile at 4pm on a Friday. That's the part a spreadsheet fails at, and where a system with a shared inbox and a required outcome field starts earning its cost. The enquiries that never get logged are disproportionately the ones that never get followed up.
What this looks like on a dashboard
Five numbers, weekly, on one screen:
| METRIC | WHAT IT TELLS YOU | WARNING SIGN |
|---|---|---|
| Inquiry conversion | Whether demand or response is your constraint | Falling while enquiry volume holds steady |
| Turnover by tenure band | Which retention problem you have | 90-day band worse than 30-day |
| Missed and late visits | Where the roster is over-optimistic | Clustering by running or day |
| Rostered vs actual hours | Where money and compliance leak | Variance above ~5% either way |
| Continuity of carer | Client retention risk, before they leave | Top two carer share below ~60% |
The thresholds are starting points, not laws set your own once you have three months of your own baseline. The point isn't the specific numbers. It's having them at all, in front of the person who can act, before the month has ended.
Where to start a realistic 30 days
Week 1. Start logging into enquiries with those six fields, today, in whatever you have. Don't wait for software. You need a baseline more than you need a system.
Week 2. Pull turnover for the last twelve months and split it into the three tenure bands. This is a painful hour with a spreadsheet, and it usually surprises people.
Week 3. Count missed, late and short visits for one recent month, missed lately. Look for clustering.
Week 4. Look at what you now know and pick one thing. Not five. The agencies that improve pick one metric, fix the underlying cause, and only then move to the next.
By the end of that month, you'll also know something else: which of these your current system can produce automatically, and which required someone to reconstruct them by hand. That's a far better basis for a software decision than any feature comparison because you'll be buying against numbers you've already proven you need.
Frequently asked questions
What metrics should a home care agency track?
Five, at minimum: inquiry-to-admission conversion with response time, carer turnover split into 30-day, 90-day and 12-month bands, missed and late visit rate, rostered-versus-actual hours variance, and continuity of carer measured as the share of visits delivered by a client's top two carers.
Why does tracking client inquiries affect revenue?
Because it turns growth into something you can diagnose. The 2026 Activated Insights Benchmarking Report found agencies tracking every inquiry report median revenue of $3.15 million against $1.40 million for those that don't, with the gap widening for five consecutive years. Without inquiry data you cannot tell whether a slow month reflects lower demand or slower response, so you cannot fix it.
What is a typical caregiver turnover rate?
Activated Insights' 2024 Benchmarking Report put home-based care turnover at 79.2%. Because that figure is so high, small improvements in early-tenure retention the 30-day and 90-day bands usually deliver more than almost any other operational change.
Can home care software reduce caregiver turnover?
Partly, and it's worth being precise. Software cannot fix uncompetitive pay. It can address the friction that drives early-tenure leavers: unstable hours, unrealistic travel time in the roster, concerns raised with no visible response, and administrative overhead. Those tend to show up in the 30- and 90-day bands.
What is continuity of carer and how do you measure it?
It's the proportion of a client's visits delivered by their most regular carers, usually measured as the share covered by their top two. It predicts client retention better than satisfaction surveys, because families rarely complain about seeing unfamiliar faces they simply leave.
Do we need software to start tracking these metrics?
No. Start in a spreadsheet this week and build a baseline. Software becomes necessary when the volume of enquiries and visits makes manual capture unreliable, particularly for enquiries arriving outside office hours, which are exactly the ones most often lost.
The bottom line
The agencies pulling away aren't doing anything mysterious. They know how many people asked about their service last month, how many became clients, and why the rest didn't. They know which of their careers are most likely to leave in the next sixty days. They know which runs are quietly failing.
None of that requires a big system. It requires deciding the numbers matter and then having something that captures them without anyone remembering to.
If you're weighing up whether your current setup can produce those five numbers on demand that's the question worth answering before you look at any feature list.
| See the platform → |
|---|
Related reading: Home Care Management Software: What It Actually Needs to Do the operational side, including visit verification and what to test in the carer app.
Fly IT Solution builds white-label business platforms and custom healthcare software from Mohali, India and Minneapolis, USA, with more than a decade of delivery across healthcare, logistics, e-commerce and field services. Our home care management platform is available as a branded deployment under your own name and domain. The observations above come from building operational software for distributed workforces and from what agency operators tell us they can't currently see.
Sources: Activated Insights, 2026 Home Care Benchmarking Report; Activated Insights 2024 Benchmarking Report, as reported in industry coverage.